The Problem
Streaming platforms like Spotify earn revenue from sustained engagement, but engagement depends on users finding music they want to keep listening to. A core tension sits at the heart of the experience: users gravitate toward what's familiar, while platforms need them to discover new content to keep the catalog feeling fresh.
Spotify already addresses this through algorithmic recommendations (Discover Weekly, Made for You, Release Radar). We wanted to test a smaller intervention sitting one level below the algorithm: can a lightweight visual cue, layered on top of normal browsing, nudge users to choose a new track over a familiar one? If yes, the implication is that recommendation isn't just an algorithmic problem — it's a presentation problem.
Hypothesis
- H1 Users shown a color-coordinated call-to-action highlighting new music suggestions will be at least 10% more likely to click on those new suggestions than users in the control group.
The hypothesis sits on a broader premise about behavioral design: subtle, well-placed visual nudges can meaningfully redirect user behavior on a platform without requiring changes to the underlying algorithm or content. If a color cue alone can shift discovery behavior by 10%, it suggests recommendation surfaces have under-explored headroom in their visual language.
Methods
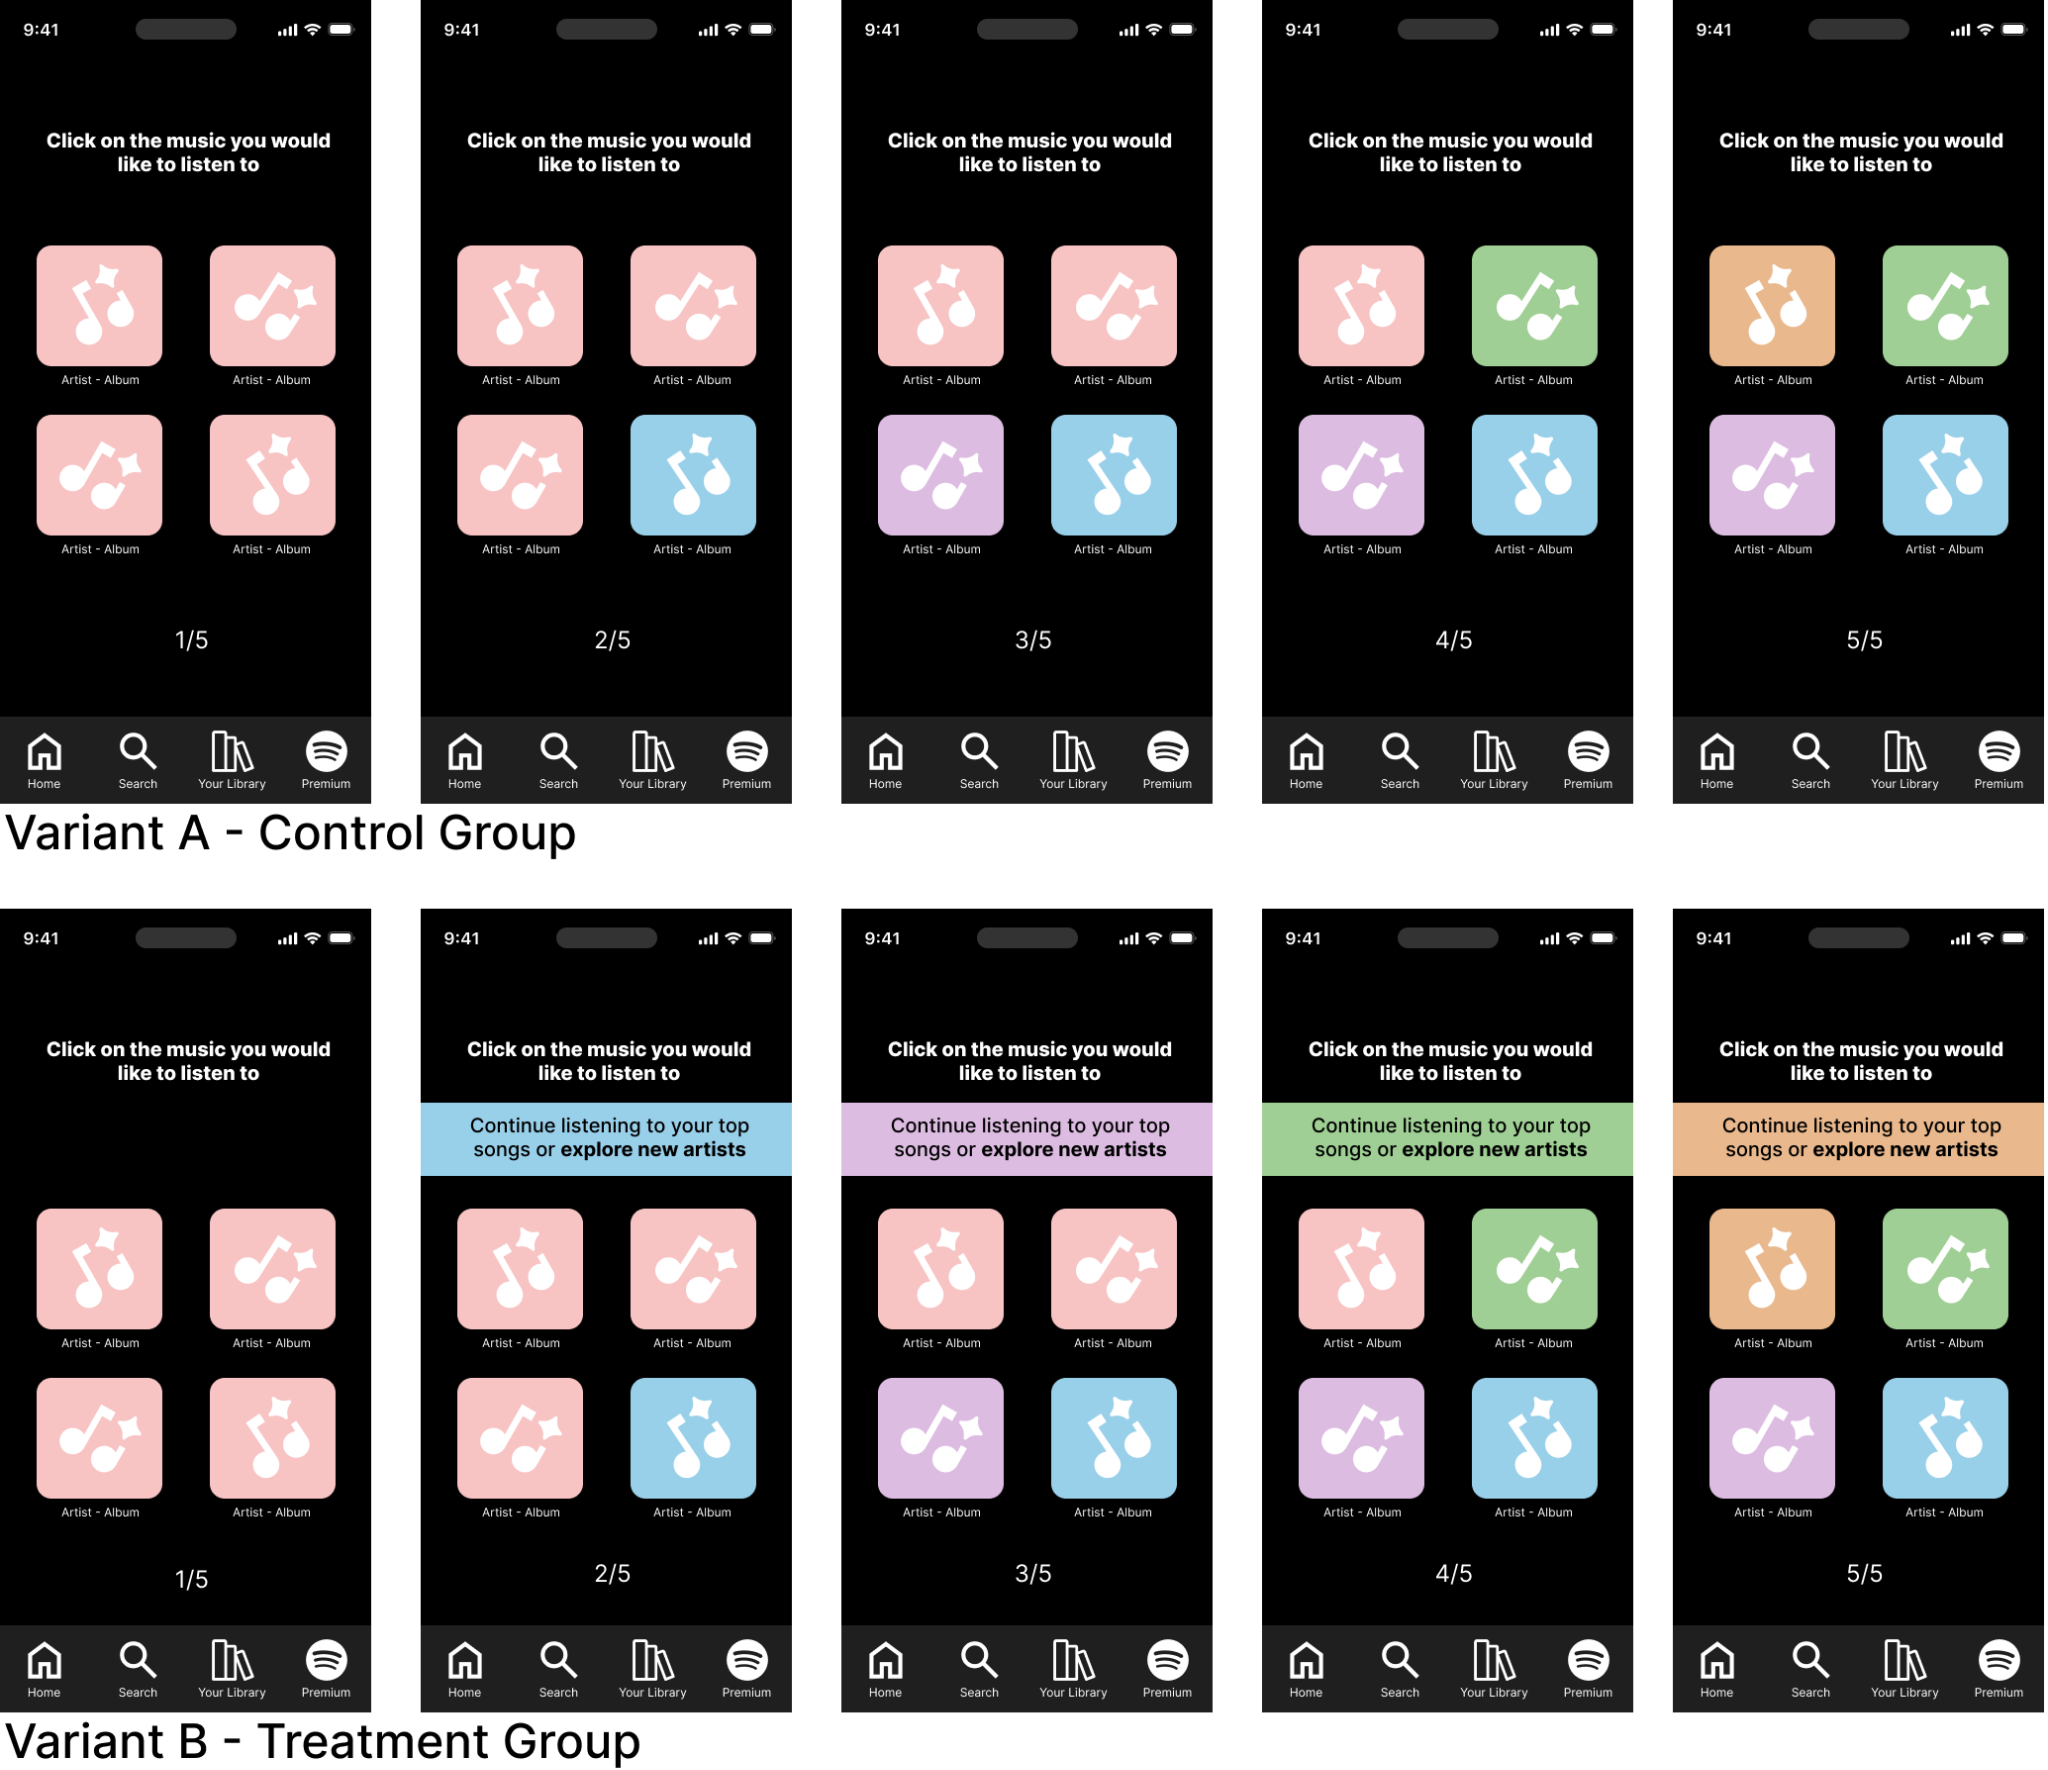
We built a simplified Spotify-style prototype in Figma representing music selections as colored buttons. Pink represented the user's existing music preferences; new colors (blue, purple, green, orange) represented new music suggestions. Participants moved through five screens, each presenting a mix of pink and new-color buttons. The first screen was identical for both groups; from the second screen onward, the treatment group also saw a color-coordinated CTA above the buttons.
64 participants were recruited from classmates, community members, colleagues, and friends-and-family of the research team, and randomly assigned to control or treatment using Maze's "Exclusive" distribution method — 32 per group. The participant pool skewed toward working-age adults: 75% were between 25 and 44 years old, with the rest distributed across other age groups.
We captured three measures of new-music engagement from Maze's heatmap tool. First, how often participants clicked the new-color option sequentially across frames. Second, the share of all individual frame selections that landed on the new color. Third, the overall proportion of clicks that were not pink — capturing willingness to move away from familiar music regardless of which specific new color was presented. Triangulating across three measures rather than relying on one was a deliberate choice: it made the result harder to dismiss as an artifact of any single measurement approach.
Key Findings
Heatmap analysis showed a consistent pattern: users exposed to the CTA chose new music more often than users who saw only the color changes. The effect held both within individual frames and across the full five-screen flow. Triangulating three measures gave us confidence that the result reflected a real behavioral shift, not a measurement artifact.
Control Group
What they saw
- 5-screen flow with color-coded music buttons
- Pink = existing preferences, other colors = new suggestions
- No directional prompt above the buttons
Engagement measures
- Sequential new-color clicks: 18.75% (6 / 32)
- Per-frame new-music clicks: 31.25% (40 / 128)
- Non-pink selections: 20% (45 / 224)
Treatment Group
What they saw
- Same 5-screen flow as control
- Color-coordinated CTA matching each frame's new color
- "Continue listening to your top songs or explore new artists"
Engagement measures
- Sequential new-color clicks: 28.125% (9 / 32) · +9.375%
- Per-frame new-music clicks: 40.625% (52 / 128) · +9.375%
- Non-pink selections: 34.4% (77 / 224) · +14.4%
"I like how it didn't just show me more recommended songs when I clicked to listen to similar songs. It still gave me options for new music."
— Maze participant, treatment group
"I thought the color coordinating was a really good idea."
— Maze participant, post-test feedback
The hypothesis held — but with an asterisk. When asked what motivated their selections, 34% of participants said "pretty colors" rather than the meaning the colors were supposed to carry. That's a real signal: the lift might be partly driven by visual novelty rather than the CTA itself. This confound shaped the follow-up experiments we proposed.
Implications for Design
A small visual cue, layered on top of an existing recommendation surface, can meaningfully shift user behavior toward discovery. But the same finding cuts the other way: if color alone can pull users toward an option, color alone can also distract them. Visual nudges are powerful and need to be designed deliberately, not treated as decoration.
→ 01 Color cues can move discovery behavior at low cost
A ~10% lift in new-content engagement from a single visual element is meaningful at platform scale. Recommendation surfaces don't only need better algorithms — they need better presentation. Subtle visual hierarchy on existing surfaces is a high-leverage, low-risk lever for product teams.
→ 02 Pair semantic cues with copy, not color alone
When 34% of users select based on aesthetic preference rather than the meaning a color was supposed to carry, the cue isn't carrying its weight. Color should reinforce a decision, not be the only signal. Pair it with copy ("new for you," "explore new artists") and iconography so the meaning is recoverable without the color.
→ 03 Accessibility belongs in the experimental design, not a retrofit
Our test relied on color perception with no screening for color blindness or visual impairment. Roughly 8% of men and 0.5% of women have some form of color vision deficiency — at our sample size, that's a meaningful share of unscreened participants. Any color-dependent experiment needs accessibility screening as a baseline, not a future improvement.
→ 04 Triangulate measures, don't rely on a single number
We measured engagement three different ways: sequential clicks, per-frame clicks, and overall non-pink selection rate. All three showed the same direction of effect, which made the result harder to dismiss than any single measure on its own. A 9.4% lift on one measure could be noise; the same direction across three is signal.
→ 05 Survey data is only useful if it's planned against the hypothesis
We collected 13 survey questions but ultimately couldn't tie most of them back to the A/B test result. Survey questions should be designed alongside the hypothesis so each one either supports a measure, segments the sample, or rules out a confound. Anything else is collection without payoff.
Limitations & What We'd Change
The 9.4% lift validated the hypothesis, but several decisions in the experimental design weakened the strength of the evidence. Worth documenting honestly:
↺ 01 Abstract color buttons over real artist artwork
Colored squares are easy to control but they don't map to how anyone actually browses Spotify. Using real artist names and album art in a future version would raise fidelity and reduce the "pretty colors" confound.
↺ 02 The missing pink button on the final frame
The last screen unintentionally omitted the pink (familiar-preference) option. That forced a behavioral choice that didn't match the prior four frames and likely added noise to the last data point. A consistency pass on the prototype would catch this.
↺ 03 Heatmaps where click logs would have served better
Maze's free tier provides heatmaps, not raw click logs. We had to read engagement patterns off of visual maps and tabulate manually — slower, less reproducible, and not directly exportable. A future test would use a platform with structured click-event data so analysis is auditable.
↺ 04 No control for interaction pace
We didn't gate progression on dwell time, so participants who rushed through may have missed the color changes or the CTA entirely. A future test would set a minimum dwell time per frame or use attention checks to identify rushed responses.
Proposed Follow-Up Experiments
Based on the "pretty colors" confound we surfaced, the team designed two follow-up experiments. Neither has been run; the prototypes and hypotheses were specified as the final Phase 3 deliverable for the course.
Replace color cues with icon cues
Same hypothesis, but new-music suggestions are signaled by an icon change instead of a color change. Removes the "pretty colors" confound and the color-blindness accessibility issue in one move.
What it tests
- Whether the CTA lift survives without color
- Whether icon literacy carries the same weight
"Diversify Music" vs. Shuffle
Replace Spotify's familiar shuffle icon with a clearly labeled "Diversify Music" button. Tests whether explainable verbiage outperforms an established symbol for prompting content diversity.
What it tests
- Explainability vs. learned symbolism
- Whether new users behave differently than established users


Artifacts & Links
The full Phase 2 report (with all 64 participant responses, 18 test blocks, and pre/post survey data) and the team's Phase 3 written follow-up report are available on request. Survey instruments are documented in the appendices of both reports.